
Yield Curve Foretelling a Recession?
Mark these words: the U.S. economy could be closer to a recession than to economic growth. In 2018, we could see an economic slowdown, and it could have severe consequences.
You see, economists use an indicator called a “yield curve” to figure where an economy could go in coming months and years. It’s very powerful.
Advertisement

What is a yield curve? It’s essentially a chart that plots yields of bonds with different maturities, from very short-term bonds to long-term one.
Economics 101
If this curve is trending upwards—that is, yields on long-term bonds are lower than the yields on short-term bonds—it suggests economic growth could be ahead. This sort of yield curve is also called a “normal curve.”
If this curve is flattening, it means the yields on the short-term bonds are very becoming very similar to long-term bonds. When this happens, it suggests the economy could be transitioning between growth and slowdown.
If the yield curve is inverted, where yields on short-term bonds are higher than the long-term bonds, it means a recession is a very possible scenario in near future.
Now, with basic economics out of the way, as it stands, if you plot a yield curve using U.S. bonds, we see the curve flattening. Investors beware.
Consider this: currently, the two-year Treasury yield is 1.84%, while the 10-year Treasury yield is 2.46%.
Over the past 18 months, the two-year Treasury yield has soared. In July of 2016, the yield on these bonds was just 0.56%, meaning it has now soared over 233%.
The 10-year Treasury yield, on the other hand, hasn’t really done much. The increases haven’t been as fast as with short-term bonds. The yield increased from 1.4% in July 2016 to 2.46% now.
You can see the chart below to get some idea about how the yield curve currently looks:
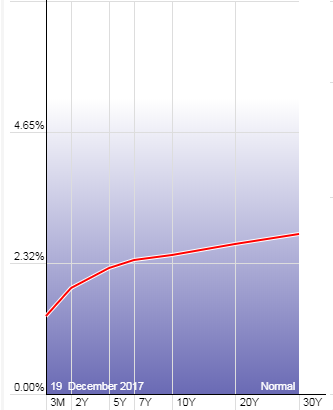
Chart Courtesy of StockCharts.com
What Does This All Mean?
The key stock indices may convince you that the U.S. economy is growing, and the headline economic data will also assure you that nothing is wrong and growth remains intact.
Sadly, oftentimes, investors forget one key point: the economic data we see, such as gross domestic product figures, are lagged indicators. They tell what has already happened in the economy.
The yield curve is something that’s a forward-looking indicator. And it is currently not saying anything good about the U.S. economy. Rather, it tells us that a recession could be nearing.
What Should Investors Be on the Lookout For?
As boring as the bonds market is to investors, it’s really worth watching. Yields on long-term bonds aren’t increasing as fast as on short-term bonds, and this is very significant. Bond markets are starting to predict a recession in the U.S. economy.
Dear reader, with time we will know more. In the meantime, don’t get too cozy; the next recession could be very detrimental to the overall economy. We already have a lot of individuals struggling, so another recession could make conditions even worse.